Greta Jung · 6 September 2026
Whale Sighting Records Integrate into Local STEM Education Programs
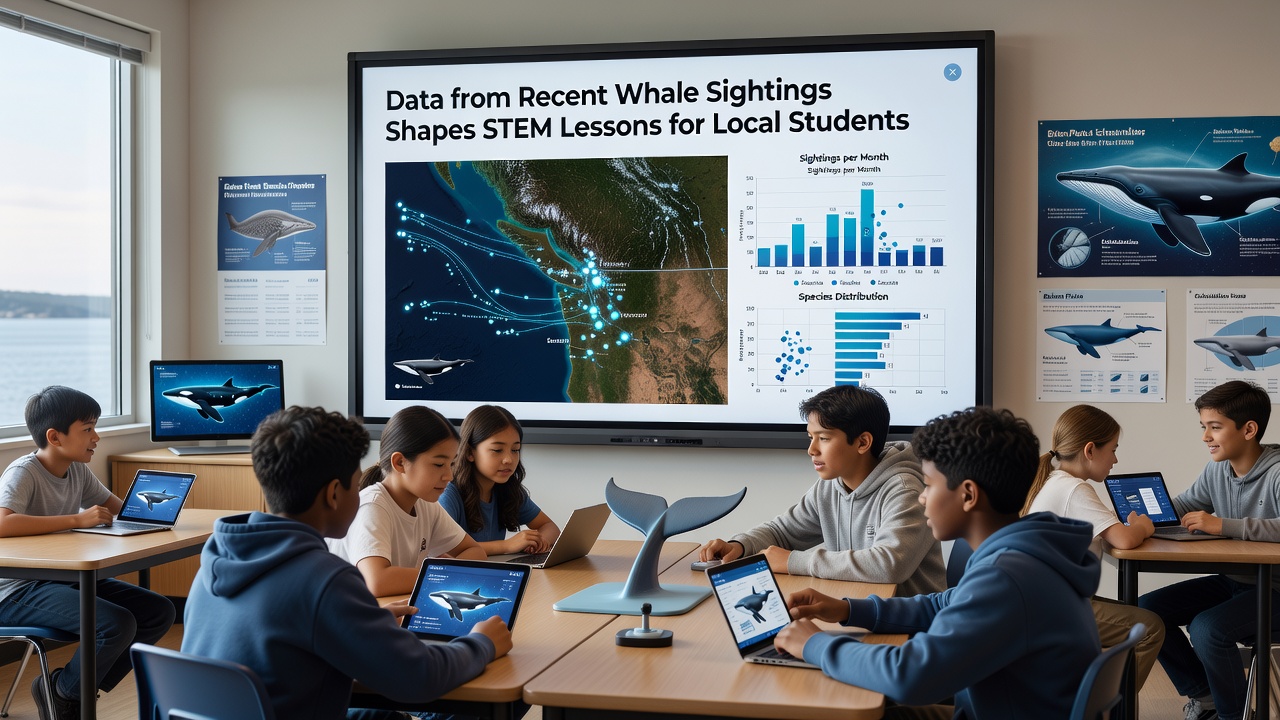
Recent whale sighting data collected along coastal routes now feeds directly into classroom activities across several school districts, where students analyze population trends, migration paths, and environmental variables as part of their science, technology, engineering, and mathematics coursework. Local marine monitoring groups have compiled thousands of verified observations since 2023, and educators have begun incorporating those figures into lesson plans that emphasize data visualization, statistical modeling, and ecological modeling techniques.
Teachers report that classes working with the datasets practice coordinate geometry when plotting latitude and longitude points, calculate average daily travel distances for different whale species, and compare sighting frequencies across seasonal periods. These exercises align with state curriculum standards for mathematics and life sciences while giving students access to real-world information gathered by researchers and trained volunteers. The approach replaces some textbook examples with live records that update each month, allowing lessons to reflect current conditions rather than static case studies.
Data Sources and Collection Methods
Multiple organizations contribute to the sighting database, including government agencies that coordinate aerial surveys and acoustic monitoring stations. According to records maintained by the National Oceanic and Atmospheric Administration, humpback and gray whale movements have shown measurable shifts in timing and distribution along the Pacific coast during the past three years. Students examine these shifts alongside ocean temperature readings and prey availability data to explore potential correlations. Similar datasets from Canadian research vessels operating in the Salish Sea provide comparative material that expands the geographic scope of classroom projects.
Volunteers upload photographs and timestamps through standardized reporting platforms, after which scientists verify species identification before the entries enter the shared repository. Schools receive cleaned, anonymized versions of the data through an educational portal managed by a regional university consortium. This process ensures accuracy while introducing students to quality control steps common in scientific workflows.
Classroom Applications and September 2026 Rollout
Beginning in September 2026, several middle and high school programs will expand their use of the sighting records to include engineering challenges that require students to design sensor housings capable of withstanding marine conditions. Participants review existing acoustic tag data to determine optimal placement locations and then model buoyancy and drag forces using simple simulation software. The projects combine biology content with physics and computer-aided design principles in a single integrated unit.
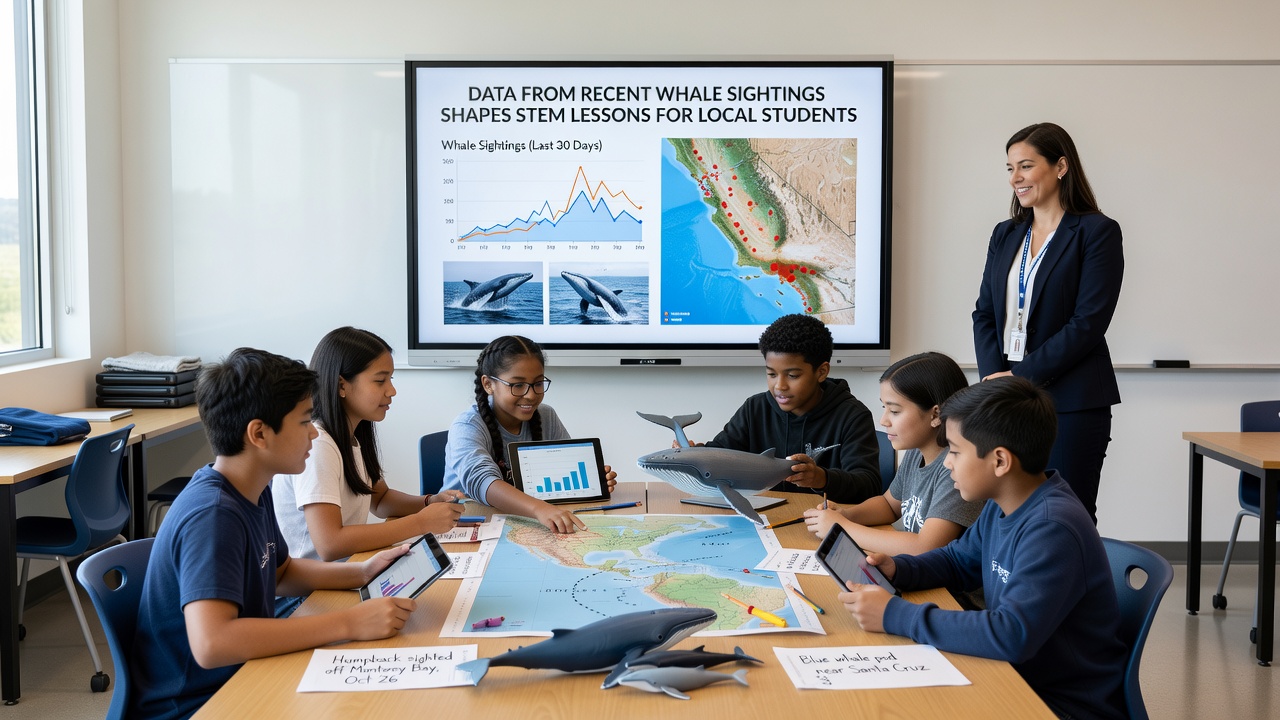
One district has paired the marine dataset with satellite imagery from the European Space Agency to study chlorophyll concentrations that indicate food sources for baleen whales. Students create layered maps that combine sighting locations with ocean color measurements, then test hypotheses about feeding hotspots. The activity spans multiple class periods and culminates in presentations that explain both the data processing steps and the ecological conclusions reached by each group.
Skill Development and Cross-Disciplinary Connections
Researchers at a university in Australia have documented how similar citizen-science datasets improve quantitative reasoning when introduced at the secondary level. Local instructors adapt those findings by embedding spreadsheet functions, basic scripting, and graphical representation tasks into the whale observation modules. Students learn to filter large files, calculate confidence intervals around sighting rates, and generate trend lines that account for observation effort.
English and history teachers have joined the effort in some schools, assigning readings about historical whaling logs that students compare with contemporary records. This cross-curricular structure lets learners examine how data collection methods have evolved while practicing technical writing when they document their own analyses. The combination keeps the focus on measurable outcomes such as improved performance on standardized data interpretation items.
Conclusion
School administrators continue to track participation numbers and assessment results as the program scales. Updated sighting reports arrive each quarter, giving teachers fresh material that maintains student interest across academic years. The integration demonstrates how publicly available scientific observations can support structured learning objectives in multiple subject areas without requiring specialized equipment beyond standard classroom computers.